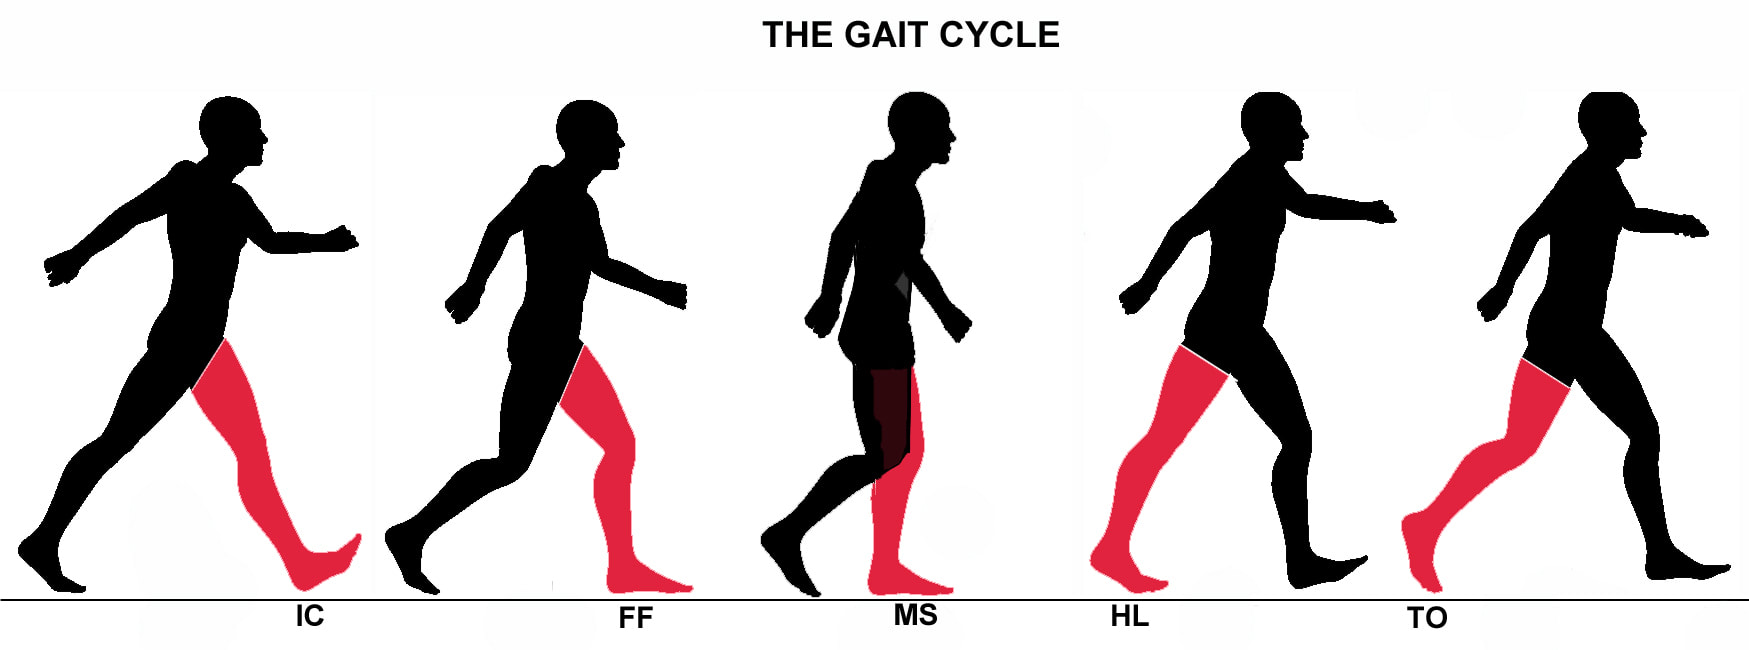
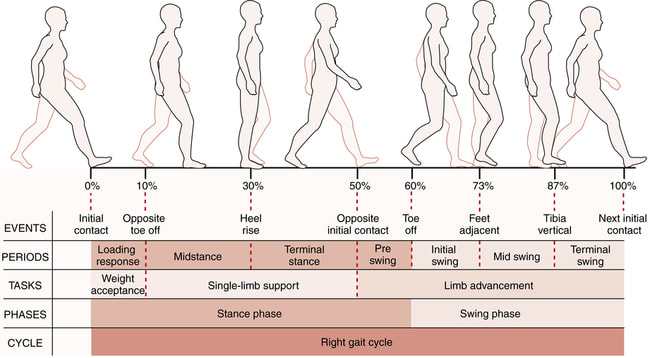
What is Gait?
Gait is simply "a person's manner of walking" Examples below:
For our first project of senior year. Our class looked in depth at the Gait of ourselves and our classmates. The main purpose of this lab was to understand what analyzing data is, and how to visualize and model data. This is a valuable skill to have as an engineer and will help us conduct experiments in the future. To conduct the experiment, various measurements had to be taken of the person being analyzed. This included leg length, height, stride length, etc. We then proceeded to use accelerators attached to the waist of the subject to track their x,y,z movements. The results of which were sent to computers where we could then use google sheets to analyze the numbers in table form, and in graph form. After spending time identifying patterns and comparing a variety of gait types we came to some conclusions. Some challenges I encountered all came with using our data in software. First there was an issue where the computer would not read semicolons, which we had to change. The second issue was trying to create a graph from the data, which my group has not figured out to this day. Everyone in the team was given equal opportunity to participate, no one person was too dominate. Our team did communicate with others to figure out what worked (like with the software issues) and what didn't. It helped both parties work a lot quicker and more efficient by sharing solutions. Having the data is very important because it is the basis for the entire project, any visualizations, arguments, and presentations need to be based on something valid otherwise they are pointless. Some personal background like if the subject is an athlete, what they do on a daily basis, etc. would have been helpful in analyzing patterns in posture. There were not many errors in the process of the recording data. A stable camera and a truly flat measured place to walk would have been good for recording data. Again, yes there were multiple problems using google sheets, most of which were solved through some experimentation with the program options.
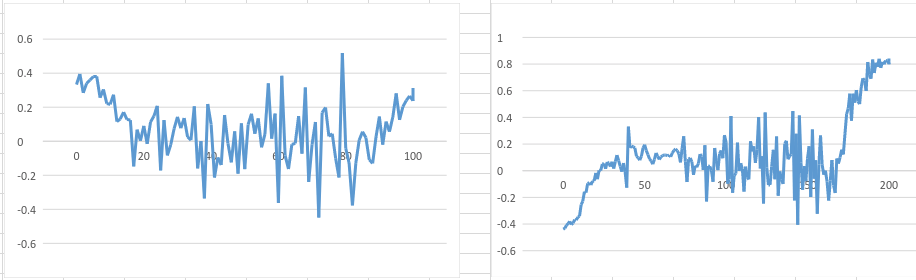
Left Graph: Tyler Abell (177.8cm) (leg length: 96cm)
Right Graph: Aiden Evans (172cm) (leg length: 88cm)
These graphs all show change in distance (forwards) over time. Ignoring the very beginning and ends of the graph which show the first acceleration and deceleration, we can see an obvious pattern. With my data, we can see the high and low points differ much more than Aiden's, which stay much closer together. The reason for this is the difference in height and leg length. Since my legs are longer, I can move forward at a faster rate, resulting in larger upward and downward spikes in the graph. Aiden on the other hand has smaller legs which cannot move as far with each step. To compensate for this his legs make more steps, but with less distance covered for each one, which results in the spikes being much more moderate.
| stem_5th_period_gait_database_-_eli_and_tyler.pdf |
Here is the raw data taken from our expirment.
